High Plains Gardening
The gardening website of the Texas High Plains Region

 “Amarillo's proximity to the paths of strong weather systems tend to cause high winds, with March and April having the strongest winds. As a result, Amarillo averages the highest annual wind speed in Texas at 14.3 mph, which makes the city one of the top 10 windiest cities in the U.S. . . . Light winter precipitation makes the spring season favorable for dust storms that occasionally reduce the visibility to less than 1 mile.” (From a recent description of Amarillo's climate.)
Wind is an ever present condition gardeners know they have to live with. Amarillo had been name the windiest city in the United States, according to a Weather.com report last spring. Lubbock, Abilene and Corpus Christi also made the top 10 list of windiest cities. This came as no surprise to Panhandle gardeners, who have long thought the area is excessively windy, and it is. Amarillo consistently is ranked in the top 10 of windiest city. But this is not an acclaim we desire.
The Texas Panhandle experiences winds between an average of 4-5 miles an hour greater than the U.S. average, with March and April being the windiest months. In fact, Amarillo has enjoyed winds below an average of 11 miles an hour only for 20 months out of the past 252 months (21 years), less than one month a year.
Wind speeds vary continuously and compilation of wind data varies from report to report. One report frequently cited is the NOAA Recorded Average Wind Speed Data through 2001. Amarillo's wind speed average represents 60 years of recorded data for an average yearly wind speed of 13.5 mph, the highest in Texas. This contrasts with the least windy city listed on the report, Oakridge, Tennessee at 4.1 mph. St. Paul Island, Alaska is credited with the highest average wind speed for this period at 17.0 mph.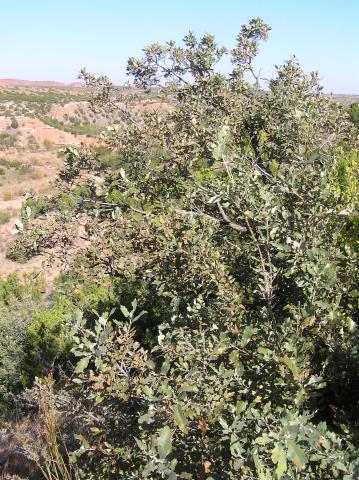
Amarillo and the Texas Panhandle's geographic location contributes to the windiness of the plains. “Because the North American prairie region lies in the center of the continent where major weather systems collide, it experiences some of the most violent weather on Earth. Warm moist air from the Gulf of Mexico clashes with frigid Arctic air and hurricane-force winds sweeping eastward off the Rocky Mountains.” (The North American Prairie, Stephen Jones and Ruth Carol Cushman). In summer, hot winds blow “principally in the High Plains, between 34 and 45 degrees in latitude.”
“Does the wind blow this way here all the time?” asked a visitor to the Plains. “No, Mister, answered the cowboy; “it'll maybe blow this way for a week or ten days, and then it'll take a change and blow like hell for awhile.”
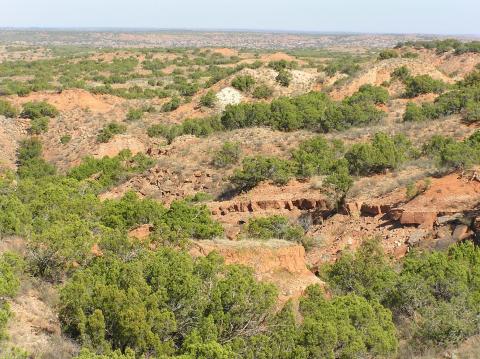
The entirety of the Texas Panhandle falls within the shortgrass prairie biome on most maps. Although some dispute the distinction between shortgrass, commonly referred to as the High Plains, and mixed grass prairies, most agree they are two separate biomes. Throughout the entire Great Plains, calcium is continuously leached out of the top soil layers and forms a hard layer underneath. From east to west, as annual moisture decreases, the hard pan is located closer to the surface. The closeness to the surface of hard pan, within two feet of the surface, is used to define the shortgrass boundary. The relative close distance to the surface of hard pan dictates, in part, the native vegetation. The shortgrass prairie is also distinguished in that plants use all available moisture before the end of the growing season leaving the subsoil dry by late summer. This condition does not normally occur in the mixed or tall grass prairies. (Grasslands, Lauren Brown). The climate of the High Plains is termed sub-humid, semi-arid and arid, depending on exact location, drier as one travels westward (The Great Plains, Walter Prescott Webb).
Winds exacerbate hot, dry, and even normal conditions by increasing the evapotranspiration rate. Although the amount of precipitation received is the factor that most determines the natural vegetation of a region, gardener's irrigation substantially mitigates this lack of natural moisture. Working the soil and soil amending breaks up the hardpan and improves soil structure, which expands the plant palette. Therefore, to gardeners, the environmental condition with least amount of control and the most adverse impact on plants and gardening is the wind.
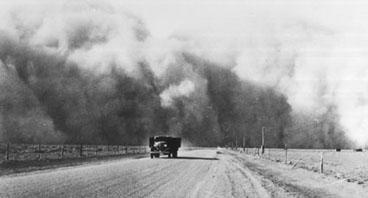 “Around noon on January 21, 1932, a cloud ten thousand feet high from ground to top appeared just outside Amarillo. The winds had been fierce all day, clocked at sixty miles an hour when the curtain dropped over the Panhandle. The sky lost its customary white, and it turned brownish then gray as the thing lumbered around the edge of Amarillo . . . .” (The Worst Hard Time, by Timothy Egan)
The above described dust storm occurred in the winter of 1932 when most plants are dormant and without leaves. Sand and dirt particles whipped into the air and blown at fierce speeds tear and shred unprotected leaves and plant tissue. Wind of this strength twists leaves, snaps twigs and branches, large limbs and even trees. Wind born dust can pit the bark on young trees, even lifting them out of the ground. Trees lean towards the northeast, having been duly trained by prevailing southwest winds. (Photo at left from Western History Collection, University of Oklahoma, "A black blizzard over Prowers Co., Colorado, 1937".)
Many dust storms blow in late winter and into the spring, as occurred during the first 4 and a half months of 2014 scarring even evergreen leaves. Once the foliage leafs out in March and April, it's soft plant tissue and spring flowers are at risk to moderate to severe damage. Even if the winds stay in the 40 mph range, a layer of dust settles over everything. This past spring, I found myself hosing down plant surfaces, not considered a waste of water during the latter stages of a 43 month-long drought.
Fortunately, weather patterns that bring a series of dust storms are rare. However, dust can blow over your garden anytime the wind gusts above 25-30 mph and across an exposed field or city lot with dirt and sand dumped awaiting a construction project. Dust will blow from road construction projects just down wind of your garden.
But even if not accompanied by dust and dirt, wind is a year long stressor to plants. Conditions are a great deal windier in country gardens than within a fence-protected city lot. Wind chill temperatures can cause frost and freeze damage on plant tissues in spring, even though the air temperature remains above freezing. Wind increases both the evaporation rate of soil and transpiration rate of plants, as reflected in higher ET rates on hot windy days.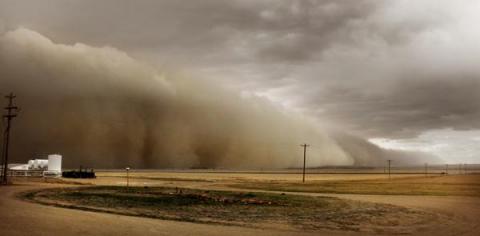
Wind can be so strong that no effort made in plants protection will be successful, as with tornados, hurricanes or hailstorms (considered more in the wind hazard category than as precipitation). Any effect of a hurricane in the Texas Panhandle usually comes in the form of moisture with winds greatly reduced by the time it reaches this far inland, and is usually welcome. And tornados, though highly destructive, are rare and cover a relatively small area compared to blizzards, dust storms and hurricanes. One can garden their entire life and not be hit by a tornado, even in the Texas Panhandle.
The suggestions I offer are mainly for the day in and day out persistent wind, whether cold or hot. These are all defensive measures, so take the offensive when it comes to defense.
Healthier plants are able to withstand the stress of wind. Having healthy plants begins with healthy soil, suited to the plant species/variety. Usuallyplants in soil with a pH nearer 7 that drains reasonably well, and sufficiently amended for its needs will thrive rather than wilt under our consistently windy climate. (Refer to Understanding and Amending Soil for more information.)
Keep plants well watered, particularly new plantings. This is of great importance. Many plants die due to the added transpiration caused by wind. If the wind is hot, it may not even be possible to water enough to overcome the deficit coupled with small root zones. The better the soil conditions, the faster the root zone will grow and establish. Perennials through their first growing season, shrubs for 1-2 years, and trees from 3-5 years need to be watched carefully to insure they have adequate moisture.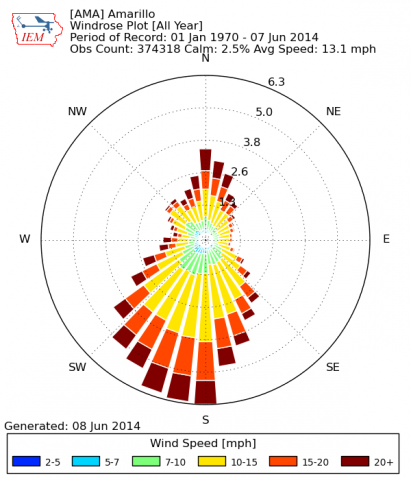
Windbreaks help. Evaluate the normal wind patterns on your landscape. South to southwest is the prevailing wind direction for the Texas Panhandle for most of the year, but experiences a strong northerly flow from late fall through to early spring. However, features on your landscape may effect the wind direction and intensity. (Annual Wind Rose for Amarillo from the National Weather Service.)

Depending on available garden space and exposure, construction of a windbreak will benefit the plants. This could be a temporary windbreak as simple as a board, 2' x 8” wide placed on the southwest side as a simple shield against the wind until the roots strengthen and develop enough to be able to overcome the increased transpiration during windy and warm conditions.
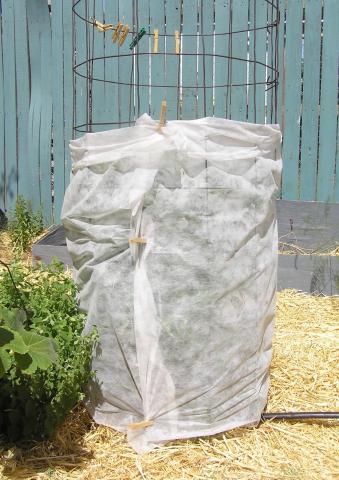 Frost cloths, row covers and cloche-like devices protect plants from wind as much as from chilly temperatures, with the added benefit of preserving moisture and creating a barrier to pests and pathogens. A thin layer of compost or worm castings applied atop a fresh seeded lawn or meadow can reduce the desiccating effects of wind, adding important nutrients in the process. Does your location dry out quickly in spring? Try covering tiny vegetable seeds scattered along the row, moisten, then place a board over. Lift and remoisten as needed and remove once the seedling emerges. Then sue the board to shield the row from the wind, or cover with a row cover and use the board to walk on in raised beds to prevent soil compaction.
If one desires a larger more permanent windbreak, a fence is better than a wall, as some wind can pass through, preventing fiercer updrafts on the windward side. If you have the available space, three rows of trees/shrubs seems to be the ideal minimum number of rows. If installing the landscape in stages, plant windbreak plants first. After these mature sufficiently, then the plants they are to protect. It's a long term method.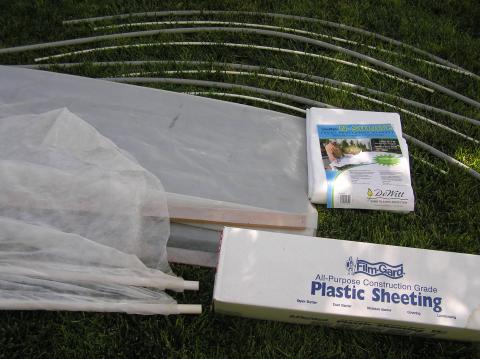
Time the planting of young tender transplants, waiting until after our periodic windy spells. It might seem this to be in impossibility during the spring, however, we do experience breaks in the wind. Especially if a dust storm or high winds are forecast, wait until the wind speeds lower. Likewise, protect plants awaiting planting from high winds just as much as you would protect them from a freeze, as they are at risk to desiccation to both their small root systems and their young, tender top growth.
Travel wind damage. Protect just purchased plants from wind damage as they are transported home in an open truck or inside a vehicle with the windows open. Damaging desiccation can occur before they are even unloaded at their planting location. Protect from prolonged direct sun as well as wind and temperatures if they're recently left the protecting environment of a greenhouse.
To stake or not stake recently planted trees? Personally, I lean more to the staking side, than not, especially for the entire first year. In our very windy climate, real damage can be done to young trees exposed to fierce winds.
In an effort to try to understand our climate better, I once more turned to Amarillo's weather data to see if there were any trends where one might predict a coming windier than normal year, or a calmer year. Does wind affect the weather, that is, temperatures and precipitation received? Is there any tie-in between above and below average temperatures to above or below average precipitation, and does wind complicate these conditions?
We know, of course, that wind contributes to transpiration and evaporation (the ET rate). An increase in wind speed increases the transpiration rate by removing the water vapor next to the leaf surface. Drier air, which can absorb additional plant moisture, replaces it in a continuous cycle of water transpiration from the plant until the plant is put under internal moisture stress and the stomates close. If it is sunny, hot, dry and windy, a good deal of moisture will be transpired quickly. A quick look back up the the chart showing the average wind speeds by month indicates the hotter summer months of July and August are calmer than at any other time of the year.
I've typed out a spreadsheet (see below) of Amarillo's mean maximum and minimum temperatures along with the annual precipitation and annual wind speed, when available back to the earliest records in 1892. Interestingly, I am not able to deduce any regular pattern to maximum and minimum temperatures compared to either annual precipitation or wind speed. I've highlighted amounts that represent above and below average temperatures, precipitation and wind. I find the data notable that the dust bowl years of 1933-1935 received 39.04 inches precipitation compared to 33.99 inches for 2011-2013. This represents a little more than 5 inches more during the dust bowl than our recent 43 month drought yet the dust bowl years produced many more and more intense dust storms, reinforcing the conclusion that farming practices contributed to dust storms. Mulching one's garden's beds and borders is helpful in reducing evaporation.
Included in this spreadsheet (see below) is a 49 year average after 1941. The further one goes back in time, the scantier the records become. Apparently, wind speed wasn't recorded prior to 1929, and then somewhat spotty until 1949. 1941 seemed to be a point that the long term averages were compiled. The average long term wind speed of 11.9mph given in 1941 does not seem to match the data given. I could find no explanation for that.
Comparing the early long term averages of 1941 to the latest thirty year average of 1981-2010, the mean maximum temperature increased 1.4° and the mean minimum temperature decreased .8°, annual precipitation decreased .63" and wind speed increased 1.7 mph. I've highlighted data that represented above and below average amounts. My determination for this was to use a reasonable amount of variance without forcing too many years outside of average. Your determination may differ.
The windiest years occurred in 1946, 1956, 1963 and 1970 and 1958 was the calmest year averaging only 11 mph -- still considerably windier than most cities in the United States. Since 1944, more years were considered below average in wind speed (16) than above average (4).
A few recent studies try to predict wind speed to weather patterns. These studies are conducted by the wind industry to determine periods of calm or windier conditions. “During an El Nino event, winter winds can be expected to be lower than the long term average.” Although studies have not been completed, it is thought that other wind indexes, such as the Southern Oscillation (positive correlation), the Arctic Oscillation (positive), the Pacific North American Index (negative) and the Carribean Index (negative correlation) will show correlation to higher or lower than the long term average.
In the end, my take away from this exercise was to note that most years fall within average years, and that wind speed on the plains is relatively constant from year to year. In years when its excessively hot, or abnormally dry, or refreshingly cooler or gratefully wetter, we can all be assured the wind will still blow.
| Amarillo Weather Data | Color Key | ||||||
| 1892-2013 | Below Avg | 1.5°-, 4”-. 1mph | |||||
| Average | + or - means range | ||||||
| Above Avg | 1.5°+, 4”+, 1mph | ||||||
| Year | Mean Maximum Temperature | Mean Minimum Temperature | Annual Precipitation | Average Wind Speed | |||
| 1892 | 66.7 | 44.6 | 15.3 | n/r | |||
| 1893 | 67.5 | 44.7 | 17.23 | n/r | |||
| 1894 | 66.4 | 45.1 | 15.81 | n/r | |||
| 1895 | 65 | 41.9 | 24.79 | n/r | |||
| 1896 | 69.6 | 44.7 | 24.28 | n/r | |||
| 1897 | 67 | 43.3 | 19.16 | n/r | |||
| 1888 | 66.9 | 42.2 | 22.54 | n/r | |||
| 1899 | 67.3 | 42.7 | 27.39 | n/r | |||
| 1900 | 68.1 | 44.4 | 24.4 | n/r | |||
| 1901 | 68 | 44.2 | 24.42 | n/r | |||
| 1902 | 68.7 | 44.1 | 23.11 | n/r | |||
| 1903 | 67.3 | 42.7 | 20.23 | n/r | |||
| 1904 | 69.9 | 44 | 21.33 | n/r | |||
| 1905 | 65.5 | 43 | 32.31 | n/r | |||
| 1906 | 67.8 | 43.2 | 24.92 | n/r | |||
| 1907 | 71 | 43.9 | 18.09 | n/r | |||
| 1908 | 70.2 | 43.5 | 19.05 | n/r | |||
| 1909 | 70.4 | 43.3 | 19.52 | n/r | |||
| 1910 | 72.9 | 44.8 | 11.15 | n/r | |||
| 1911 | 70.1 | 45 | 22.73 | n/r | |||
| 1912 | 67.7 | 41.8 | 15.08 | n/r | |||
| 1913 | 67.9 | 43.2 | 18.98 | n/r | |||
| 1914 | 70.6 | 44.7 | 19.27 | n/r | |||
| 1915 | 68 | 43.1 | 27.35 | n/r | |||
| 1916 | 71.3 | 43.4 | 16.43 | n/r | |||
| 1917 | 70.2 | 42.4 | 17.06 | n/r | |||
| 1918 | 69.9 | 43.7 | 18.12 | n/r | |||
| 1919 | 67 | 43.1 | 22.01 | n/r | |||
| 1920 | 68.9 | 43.3 | 21.82 | n/r | |||
| 1921 | 72 | 45.8 | 25.24 | n/r | |||
| 1922 | 70.9 | 45.2 | 19.85 | n/r | |||
| 1923 | 67.6 | 44.7 | 39.75 | n/r | |||
| 1924 | 69 | 43 | 17.9 | n/r | |||
| 1925 | 70.6 | 43.4 | 23.53 | n/r | |||
| 1926 | 68.8 | 44.8 | 23.25 | n/r | |||
| 1927 | 72.9 | 45.7 | 15.42 | n/r | |||
| 1928 | 69.8 | 45.4 | 32.34 | n/r | |||
| 1929 | 68.5 | 44.5 | 18.87 | 8.1 | |||
| 1930 | 70.6 | 46 | 17.58 | n/r | |||
| 1931 | 70.3 | 46.9 | 18.35 | 8.2 | |||
| 1932 | 69.8 | 45.3 | 21.14 | 9.2 | |||
| 1933 | 74 | 47.4 | 12.22 | 10 | |||
| 1934 | 74.6 | 48.2 | 13.33 | 9.7 | |||
| 1935 | 71 | 46.8 | 13.49 | 9.7 | |||
| 1936 | 70.8 | 46.1 | 19.72 | 9.5 | |||
| 1937 | 70.6 | 46.1 | 17.1 | 9.8 | |||
| 1938 | 72.4 | 47.7 | 19.1 | 9.8 | |||
| 1939 | 72.9 | 47.2 | 21.01 | n/r | |||
| 1940 | 70.7 | 46.1 | 13.62 | n/r | |||
| 1941 | 67.8 | 45.3 | 37.21 | 12.6 | |||
| Means 1892-1941* | 69.5° | 44.5° | 20.99” | 11.9mph | |||
| Less/greater than avg | 1.5°<, 1.5° > 69.5° | 1.5°<, 1.5° > 44.5° | 4”<, 4”> 21” | 1mph<, 1mph> 11.9 mph | |||
| Year | Mean Maximum Temperature | Mean Minimum Temperature | Annual Precipitation | Average Wind Speed | |||
| 1942 | 69.8 | 43.1 | 21.62 | n/r | |||
| 1943 | 71.2 | 43.5 | 18.38 | n/r | |||
| 1944 | 69.1 | 44 | 23.6 | 14.3 | |||
| 1945 | 71.2 | 43.8 | 17.19 | n/r | |||
| 1946 | 72.2 | 45 | 20.8 | 15 | |||
| 1947 | 69.8 | 43 | 15.48 | 14.2 | |||
| 1948 | n/r | n/r | 24.38 | n/r | |||
| 1949 | 69.1 | 43.4 | 25.5 | 12.4 | |||
| 1950 | 72.7 | 43.1 | 23.18 | 12.2 | |||
| 1951 | 70.9 | 42.8 | 25.29 | 13.6 | |||
| 1952 | 72 | 44 | 12.15 | 11.7 | |||
| 1953 | 74 | 45.3 | 13.05 | 12.3 | |||
| 1954 | 74.8 | 46 | 13.89 | 14.2 | |||
| 1955 | 71.7 | 43 | 13.71 | 13.7 | |||
| 1956 | 72.9 | 43.5 | 9.94 | 15.1 | |||
| 1957 | 68.6 | 44.2 | 21.24 | 12.3 | |||
| 1958 | 68.5 | 43.8 | 23.29 | 11 | |||
| 1959 | 69.7 | 42.7 | 22.81 | 12.5 | |||
| 1960 | 67.9 | 42.9 | 36.67 | 12.3 | |||
| 1961 | 70.1 | 42.9 | 22.44 | 13.9 | |||
| 1962 | 72 | 45 | 29.76 | 13.6 | |||
| 1963 | 72.8 | 44.7 | 17.3 | 14.6 | |||
| 1964 | 71.5 | 44.2 | 17.97 | 14.4 | |||
| 1965 | 71.4 | 44.2 | 20.09 | 13.6 | |||
| 1966 | 69.91 | 42.7 | 14.91 | 14.5 | |||
| 1967 | 71.3 | 44.6 | 16.85 | 14.4 | |||
| 1968 | 70.2 | 44.1 | 17.97 | 13.8 | |||
| 1969 | 70.5 | 45.1 | 22.55 | 12.9 | |||
| 1970 | 71.3 | 44 | 9.56 | 13.2 | |||
| 1971 | 69.6 | 43.2 | 23.04 | 14.7 | |||
| 1972 | 69.5 | 42.1 | 15.34 | 13.9 | |||
| 1973 | 69.9 | 44.2 | 18.05 | 13.7 | |||
| 1974 | 70.4 | 45.1 | 23.09 | 14 | |||
| 1975 | 69.8 | 42.7 | 21.08 | 14.1 | |||
| 1976 | 69.2 | 41.2 | 16.24 | 13.8 | |||
| 1977 | 71.8 | 45.9 | 19.18 | 13.9 | |||
| 1978 | 68.5 | 43.5 | 22.01 | 13.4 | |||
| 1979 | 68.1 | 41.7 | 20.46 | 13.5 | |||
| 1980 | 70.7 | 42.9 | 13.39 | 13.7 | |||
| 1981 | 72.8 | 44.9 | 21.09 | 13.6 | |||
| 1982 | 70.7 | 42.1 | 18.6 | 14.1 | |||
| 1983 | 68.3 | 42.3 | 14.98 | 13.5 | |||
| 1984 | 69 | 42.7 | 19.23 | 12.6 | |||
| 1985 | 69.9 | 44.1 | 22.4 | 13 | |||
| 1986 | 70.6 | 44.8 | 25.33 | 12.9 | |||
| 1987 | 68.5 | 43.2 | 22.02 | 12.4 | |||
| 1988 | 69.5 | 42.2 | 24.69 | 13.3 | |||
| 1989 | 70.8 | 42.3 | 19.55 | 12.5 | |||
| 1990 | 71.6 | 43.9 | 17.51 | 13.2 | |||
| 1991 | 70.6 | 44 | 15.92 | 13.1 | |||
| 1992 | 69.8 | 43.5 | 20.63 | 12.3 | |||
| 1993 | 68.9 | 41.7 | 18.43 | 13.3 | |||
| 1994 | 71.9 | 43.3 | 16.54 | 12.8 | |||
| 1995 | 71 | 43.2 | 18.33 | 12.7 | |||
| 1996 | 71.7 | 42.9 | 20.51 | 13.1 | |||
| 1997 | 68.2 | 42.9 | 24.95 | 12.5 | |||
| 1998 | 72.9 | 45.1 | 17.15 | 12 | |||
| 1999 | 71.1 | 44.3 | 26.57 | 12.4 | |||
| 2000 | 72.6 | 44.6 | 18.39 | 13.1 | |||
| 2001 | 72.3 | 45.7 | 18.69 | 12.5 | |||
| 2002 | 70.7 | 43.9 | 18.25 | 13.4 | |||
| 2003 | 72.2 | 44.1 | 13.42 | 12.7 | |||
| 2004 | 69.9 | 44.8 | 27.31 | 12.5 | |||
| 2005 | 70.6 | 44.5 | 15 | 12.4 | |||
| 2006 | 72.1 | 44.3 | 21.88 | 12.9 | |||
| 2007 | 70.3 | 44.9 | 22.5 | 12.8 | |||
| 2008 | 72.1 | 43.3 | 22.42 | 13.7 | |||
| 2009 | 71.5 | 43.3 | 21.15 | 12.8 | |||
| 2010 | 71.2 | 44.6 | 26.54 | 12.9 | |||
| 2011 | 75.4 | 44.6 | 7.01 | 13.3 | |||
| 2012 | 77.7 | 48.6 | 11.78 | 12.9 | |||
| 2013 | 72.3 | 44.2 | 15.2 | 13.2 | |||
| Mean Maximum Temperature | Mean Minimum Temperature | Annual Precipitation | Average Wind Speed | ||||
| 1981-2010 30 Yr Means | 70.9° | 43.7° | 20.36” | 13.6mph | |||
| Less/greater than avg | 1.5°<, 1.5° > 70.9° | 1.5°<, 1.5° > 43.7° | 4”<, 4”> 20.36” | 1mph<, 1mph> 13.6 mph | |||
| Color Key | |||||||
| Below Avg | 1.5°-, 4”-. 1mph | ||||||
| Average | + or - means range | ||||||
| Above Avg | 1.5°+, 4”+, 1mph |
*NOAA Local Climatological Data, and Amarillo, Annual Climatological Data
Average wind speeds, NOAA Climatological Data
Brown, Lauren, Grasslands, an Audubon Society Nature Guide, Alfred A. Knopf, Inc., 1985.
Dimmitt, Mark, A., “Biomes & Communities of the Sonoran Desert Region,” Arizona-Sonora Desert Museum, A Natural History of the Sonoran Desert, University of California Press, 2000.
Egan, Timothy, The Worst Hard Time, Houghton Mifflin Company, 2006.
El Niño Southern Oscillation, Climate Indices & their relationship with Wind Speed in the Texas Panhandle,” Andrew Oliver, Phd., RES Americas, Broomfield, Co, April 8th, 2010.
Jones, Stephen R. and Ruth Carol Cushman, The North American Prairie, Houghton Mifflin Company, 2004.
NOAA Local Climatological Data, Amarillo, Annual Meteorological Summary, 1941.
Rahn, James J., Making the Weather Work for You, Garden Way Publishing, 1979.
Smith, Charles W. G., The Weather-Resilient Garden, Storey Publishing, 2004.
Taylor, Jane, Weather in the Garden, John Murray Publishers, Ltd. London, 1996.
Webb, Walter Prescott, The Great Plains, University of Nebraska Press, 1981.
Angie Hanna, January 30, 2015